English
  Español
  Português
  Deutsch
  Français
  Italiano
  Polski
  Română
  Українська
  Русский
  Türkçe
  العربية
  日本語
日本語  한국어
한국어  ไทย
ไทย  汉语
汉语  हिन्दी
  Bahasa
 Academically reviewed by Dr. Jennifer Schulz, Ph.D., associate professor of psychology
Food Race Test
Discover what race you eat like with the Food Race Test – a fun, eye-opening quiz based on real-world, scientific data.
Drawing from a large-scale analysis of U.S. dietary survey responses, a machine learning model was able to predict people's self-reported racial group with 82% accuracy using nothing but their food preferences.
Now it's your turn: answer yes or no to 32 carefully selected foods and see which cultural palate your tastes align with most closely.
Question 1 of 32
How much do you like...
Bacon
| Less | More |
NEXT
The Food Race Test is a captivating, data-driven quiz that reveals how everyday food preferences can surprisingly predict self-reported racial or ethnic identity. At its core lies rigorous empirical analysis from large-scale U.S. dietary surveys, demonstrating that cultural food patterns are far more structured—and predictable—than casual stereotypes might suggest.
The foundation traces back to a detailed secondary analysis of public dietary data, most likely drawn from the National Health and Nutrition Examination Survey (NHANES), a gold-standard program run by the Centers for Disease Control and Prevention (CDC). NHANES has collected nationally representative health and nutrition data since the 1970s, including detailed Food Frequency Questionnaires (FFQs) where participants report how often they consume hundreds of specific foods and beverages. Combined across multiple survey cycles, these datasets encompass tens of thousands of respondents who also self-identify their race/ethnicity (typically non-Hispanic White, non-Hispanic Black, Hispanic, and Asian categories).
In a 2025 analysis published on Substack by East Hunter titled “Do Black people really like fried chicken?”, a researcher applied a random forest classifier—a robust machine learning algorithm widely used in predictive modeling—to this NHANES-derived data. Using only self-reported food consumption frequencies as predictors (with no demographic inputs like age, income, or location), the model classified individuals into their correct self-reported racial/ethnic group with 82% accuracy on a holdout test sample. This far exceeds the ~40% baseline expected by random guessing across four groups. The model’s performance was further validated by a Cohen’s Kappa of 0.74, indicating “substantial” agreement beyond chance—a strong statistical endorsement in classification tasks.
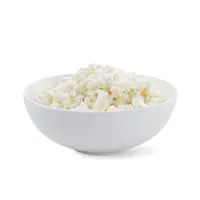
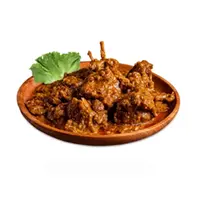
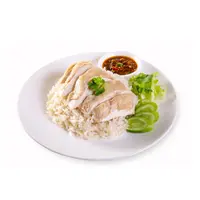
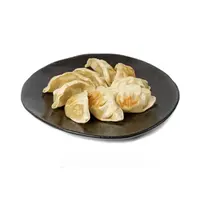
This high accuracy underscores an empirical reality: systematic differences in food preferences emerge across U.S. ethnic groups, driven by cultural traditions, regional histories, immigration patterns, and family recipes passed down through generations. For instance, higher reported consumption of stir-fried vegetables, tofu, or dumplings strongly signals Asian preferences; Tex-Mex items like tortillas as sides or salsa point toward Hispanic patterns; fried chicken, gravies, or certain candies align with Black preferences; while wine, diet sodas, or cottage cheese tilt toward White patterns. These signals are not random—the random forest algorithm identified the most discriminative foods through feature-importance rankings, producing clear bar charts of “extra preference relative to other ethnicities.”
The Food Race Test distills this data-driven insight into a concise, engaging quiz format. It features the top eight highest-predictive items per group, directly drawn from the analysis’s ranked preference charts. Users simply answer “yes” or “no” to whether they regularly enjoy each food (at least monthly), then submit their responses for an instant result revealing which ethnic pattern their palate most closely matches.
While playful on the surface, the test’s power lies in its grounding in real, large-scale survey data and validated machine learning results. It highlights how deeply culture embeds itself in daily habits, turning something as personal as taste into a surprisingly reliable proxy for group identity—all backed by empirical evidence, not anecdote. In an era of big data, this work demonstrates the subtle, quantifiable ways human differences manifest, inviting reflection on the intersections of food, culture, and identity.
References
- Bennett, G., Bardon, L. A., & Gibney, E. R. (2022). A comparison of dietary patterns and factors influencing food choice among ethnic groups living in one locality: A systematic review. Nutrients, 14(5), Article 941. https://doi.org/10.3390/nu14050941
- East Hunter. (2025, December 31). Do Black people really like fried chicken? East Hunter.

Why Use This Test?
Use the Food Race Test to explore how culture quietly shapes everyday choices you rarely think about. Built on real, large-scale U.S. dietary data and validated machine learning models, the test goes beyond stereotypes to reveal measurable patterns in taste. In just a few minutes, you’ll see how your food preferences align with broader cultural trends—making data science personal, playful, and surprisingly insightful. It’s a fun way to reflect on identity through evidence, not assumptions.